"A study reports p = 0.08. Which interpretation is correct?"
Four answer choices. All of them sound reasonable. No chart to anchor you. This is where biostatistics questions get tricky—not because the math is hard, but because the language is slippery. The INBDE knows exactly which misinterpretations are common, and those become the wrong answers.
About a third of biostatistics questions work this way: no visual, just a concept wrapped in a clinical scenario. This post covers the four that show up most often—levels of evidence, p-values, confidence intervals, and Type I/II errors—with the specific traps the exam sets for each.
If you haven't covered the chart-based questions yet: Part 1 (2x2 tables, box plots, scatter plots) and Part 2 (forest plots, survival curves, ROC curves).
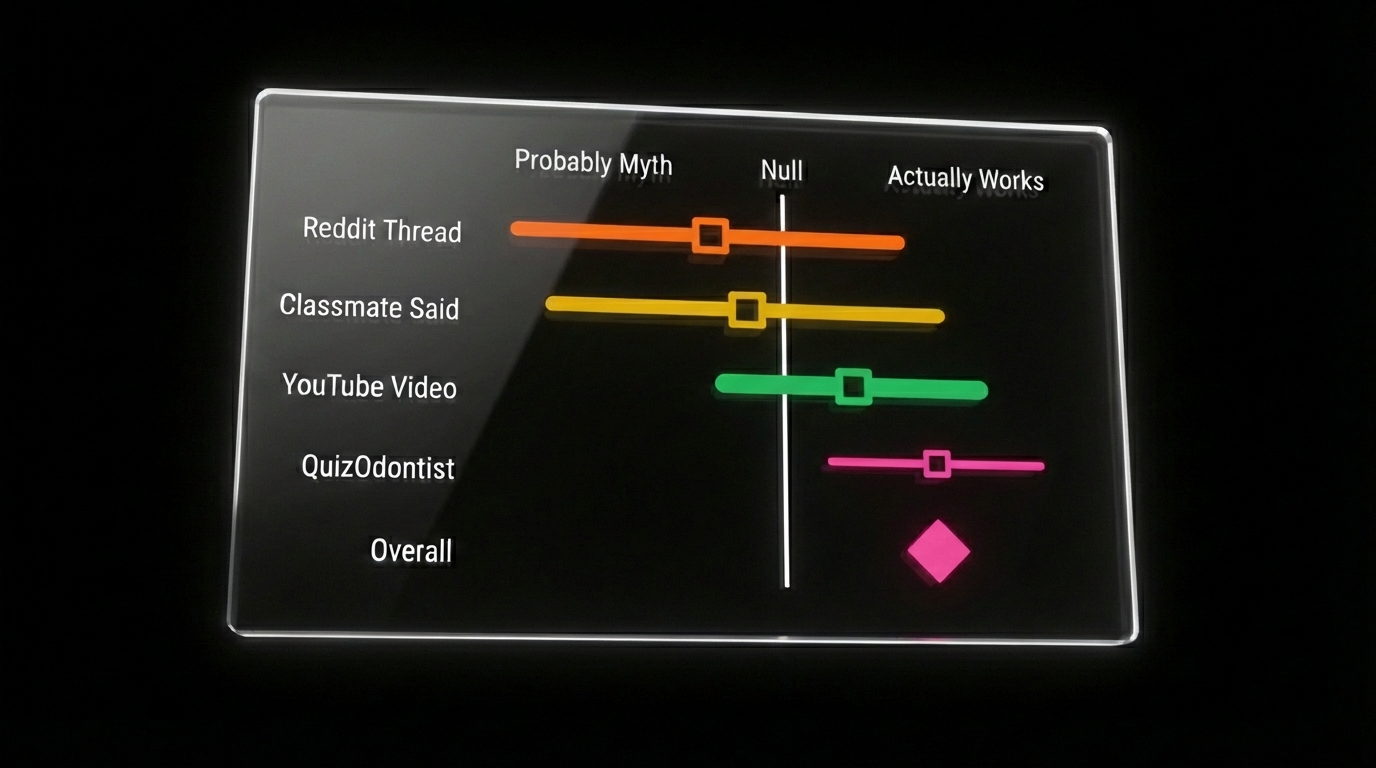
1. Levels of Evidence
The INBDE loves asking: "Which study design provides the strongest evidence?"
| Rank | Study Type | Why It's Ranked Here |
|---|---|---|
| 1 | Systematic Reviews / Meta-Analyses | Combines multiple studies, reducing the chance that any single flawed study misleads you |
| 2 | Randomized Controlled Trials (RCTs) | Randomization eliminates confounding—groups are identical except for the treatment |
| 3 | Cohort Studies | Follows groups over time, but no randomization means confounders can sneak in |
| 4 | Case-Control Studies | Compares people with/without disease, but relies on memory and records (retrospective bias) |
| 5 | Case Series / Case Reports | Just descriptions, no comparison group at all |
| 6 | Expert Opinion | Someone's informed guess—no data |
Why RCTs are special: Randomization. When you randomly assign patients to treatment vs. control, the groups are statistically identical in every way—age, genetics, habits, everything—except the treatment. Any difference in outcomes must be from the treatment. Observational studies can't do this, so they can only show association, never causation.
The INBDE trap: A question describes a study where researchers "followed 500 patients who chose to get implants vs. bridges." Students see "followed over time" and think RCT. But there's no randomization—patients chose their treatment. That's a cohort study. Causation cannot be proven.
2. P-Values
What a p-value actually means:
"If the treatment truly has zero effect, what's the probability we'd see results this extreme just by random chance?"
Think of it this way: You flip a coin 10 times and get 8 heads. Is the coin unfair? Maybe. But even a fair coin will give you 8+ heads about 5% of the time just by luck. The p-value quantifies that "just by luck" probability.
- p = 0.03 → There's a 3% chance you'd see this result if the treatment does nothing. That's unlikely enough that we call it "significant."
- p = 0.50 → 50% chance it's random noise. Not significant at all.
- p < 0.05 → The conventional threshold for "statistically significant"
The INBDE traps:
Trap 1: "P-value = probability the treatment doesn't work"
Wrong. It's the probability of seeing this data if the treatment doesn't work. The p-value assumes no effect and asks how surprising the data would be under that assumption. The INBDE will give you answer choices that flip this—watch for it.
Trap 2: "P = 0.049 vs P = 0.051"
These are functionally identical. A result at p = 0.051 isn't "proven false." The 0.05 cutoff is arbitrary—a useful convention, not a magic threshold. The INBDE may test whether you understand that p-values just above and below 0.05 should be interpreted similarly.
Trap 3: "Significant means important"
Statistical significance ≠ clinical significance. A drug might lower blood pressure by 0.5 mmHg with p = 0.001. Statistically significant (very unlikely to be chance), but clinically meaningless (0.5 mmHg doesn't matter to patients).
3. Confidence Intervals
A 95% confidence interval gives you a range: "We're 95% confident the true effect falls somewhere in here."
The shortcut that saves time on exam day:
If the 95% CI excludes the null value → p < 0.05 → Statistically significant
You don't need to see the p-value. Just check the confidence interval:
- For ratios (OR, RR, HR): null = 1.0
- For differences (mean difference, risk difference): null = 0
| Result | 95% CI | Significant? |
|---|---|---|
| OR = 2.5 | 1.3 to 4.8 | Yes (doesn't include 1.0) |
| OR = 2.5 | 0.8 to 7.8 | No (includes 1.0) |
| Mean diff = 3.2 mm | 0.5 to 5.9 | Yes (doesn't include 0) |
| Mean diff = 3.2 mm | -1.1 to 7.5 | No (includes 0) |
Why width matters: A narrow CI means precision (large sample, reliable estimate). A wide CI means uncertainty (small sample, interpret cautiously).
The INBDE loves showing a dramatic effect size with a CI so wide it's meaningless. "Wow, OR of 5.0!" But if the CI is 0.3 to 84.0, that result tells you almost nothing—the true effect could be protective, harmful, or nonexistent.
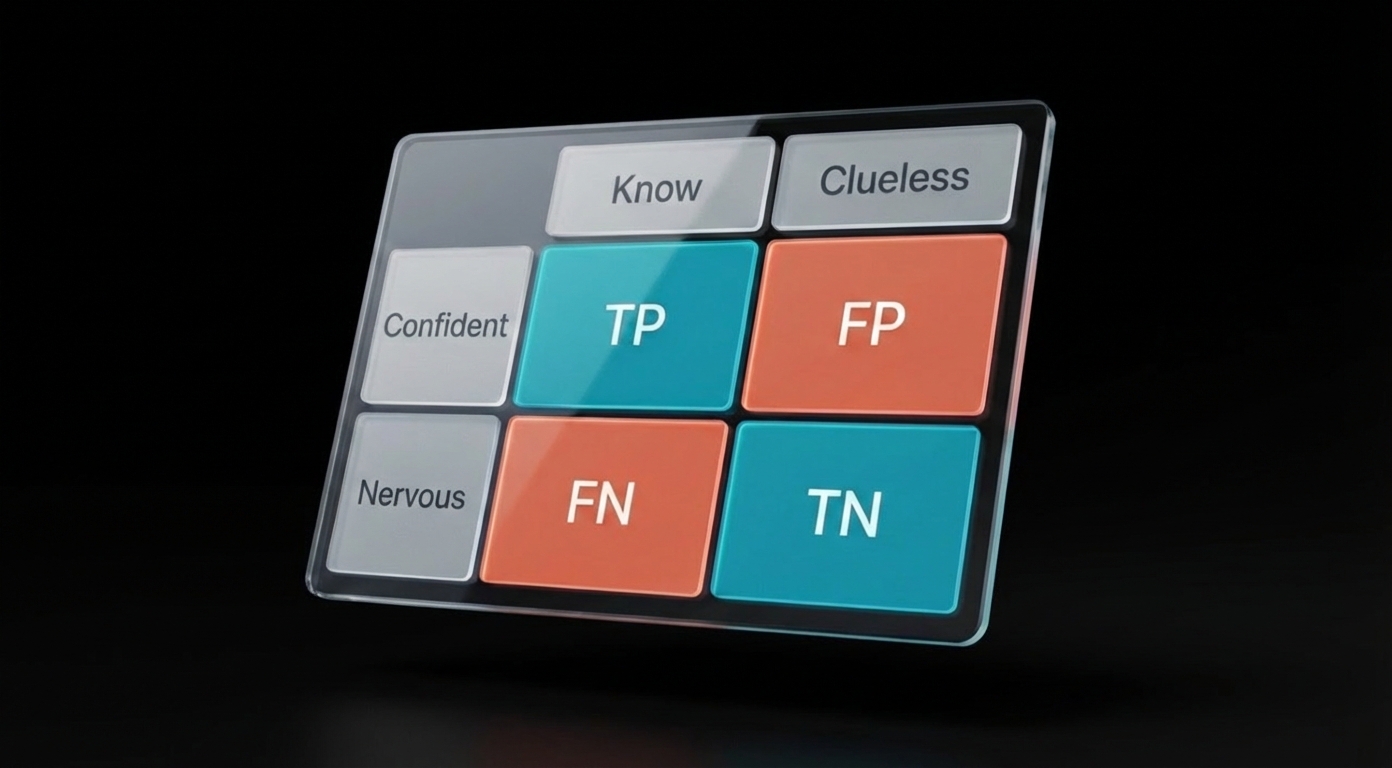
4. Type I and Type II Errors
| Error Type | What Happened | Plain English | Greek Letter |
|---|---|---|---|
| Type I | Concluded there's an effect when there isn't | False alarm (false positive) | α (alpha) |
| Type II | Missed a real effect | Missed opportunity (false negative) | β (beta) |
Memory trick: Type I = "I see something that isn't there" (false positive). Type II = "II bad—I missed it" (false negative).
Alpha (α) is the probability of Type I error. When researchers set α = 0.05, they're accepting a 5% chance of falsely concluding there's an effect when there isn't one.
Power is the probability of avoiding Type II error. Power = 1 - β. The standard target is 80% power, meaning an 80% chance of detecting a real effect if one exists.
The INBDE scenario: A study finds no significant difference between treatments (p > 0.05). The question asks what might explain this. If the study had only 20 patients per group, the answer is almost always: "The study was underpowered and may have committed a Type II error (missed a real effect)."
Small sample size → Low power → High risk of Type II error → Non-significant result even when there's a real difference.
How These Connect
- Study design determines what conclusions you can draw. RCTs prove causation; observational studies show association.
- P-values tell you whether the result is likely due to chance—but not the size of the effect or whether it matters clinically.
- Confidence intervals give you both: the range of plausible effect sizes and whether the result is significant (CI excludes null = significant).
- Errors remind you that statistics can fail. Type I is controlled by alpha. Type II is controlled by power (sample size).
When a question gives you a study to evaluate:
- What type of study is it? (Can it prove causation?)
- Is the result significant? (Check p-value or CI)
- Is it clinically meaningful? (Effect size, not just p-value)
- If not significant, could it be underpowered? (Small sample = Type II risk)
The Series
Part 1: Foundation — 2x2 Tables, Box Plots, Scatter Plots
Part 2: Advanced Charts — Forest Plots, Survival Curves, ROC Curves
Part 3: Concepts (this post) — Levels of Evidence, P-Values, Confidence Intervals, Type I/II Errors
That covers the ~50 biostatistics questions on the INBDE. The exam gives you 60-90 seconds per question—not enough time to reason through definitions. The patterns need to be automatic: see "p = 0.08," know it's not significant but doesn't prove equivalence. See a CI that crosses 1.0, know the result isn't significant regardless of what the point estimate looks like.
Sources: