You've been prepping for weeks. Endo, perio, prostho, oral surgery — procedures you've actually performed on actual patients. That feels like real exam prep.
Meanwhile, Section 3 sits in the corner of your study plan like a textbook you bought but never opened. Data, Research Interpretation, and Evidence-Based Dentistry. You'll get to it. Eventually. Probably the weekend before the exam. Maybe on the drive to Prometric.
You won't. And those 40 questions you skipped? They were probably the easiest 40 questions on the entire exam.
The Procrastination Trap
Most ADAT candidates follow the same playbook. Start with clinical sciences because it feels productive. You're reviewing procedures you've actually performed. Move to biomedical sciences because at least it's anatomy and pathology, things that feel connected to real patients. Save biostatistics for "later" because nobody became a dentist to interpret forest plots.
The problem isn't that you're lazy. The problem is that biostatistics doesn't feel like dentistry. There's no patient in front of you. No radiograph to read. No lesion to identify. It's just numbers, tables, and abbreviations that remind you of a stats class you barely survived in undergrad.
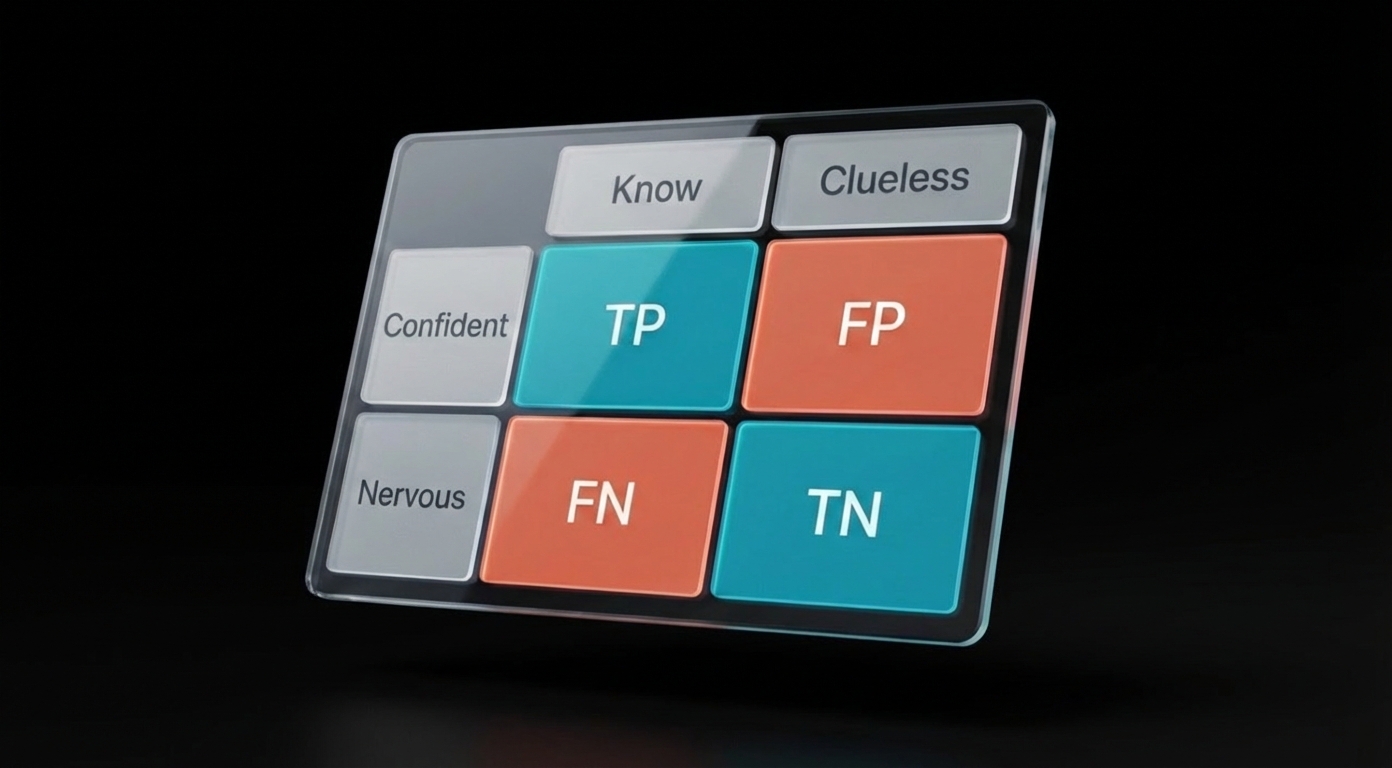
So you push it. And push it. And then you're sitting in the exam, staring at a 2x2 table, trying to remember whether sensitivity is the top row or the left column. Forty questions. Gone.
It's a strategic error. And it's fixable.
Still deciding whether ADAT is even the right exam for you?

ADAT: Who Needs It and Who Doesn't
The Math That Should Change Your Mind
The ADAT consists of 200 multiple-choice questions split across three sections, all completed in a 4.5-hour window. According to the ADA's official ADAT page, Section 3 — Data, Research Interpretation, and Evidence-Based Dentistry — accounts for 40 of those questions.
That's 20% of your entire exam in a single section.
| Section | Questions | What You're Up Against |
|---|---|---|
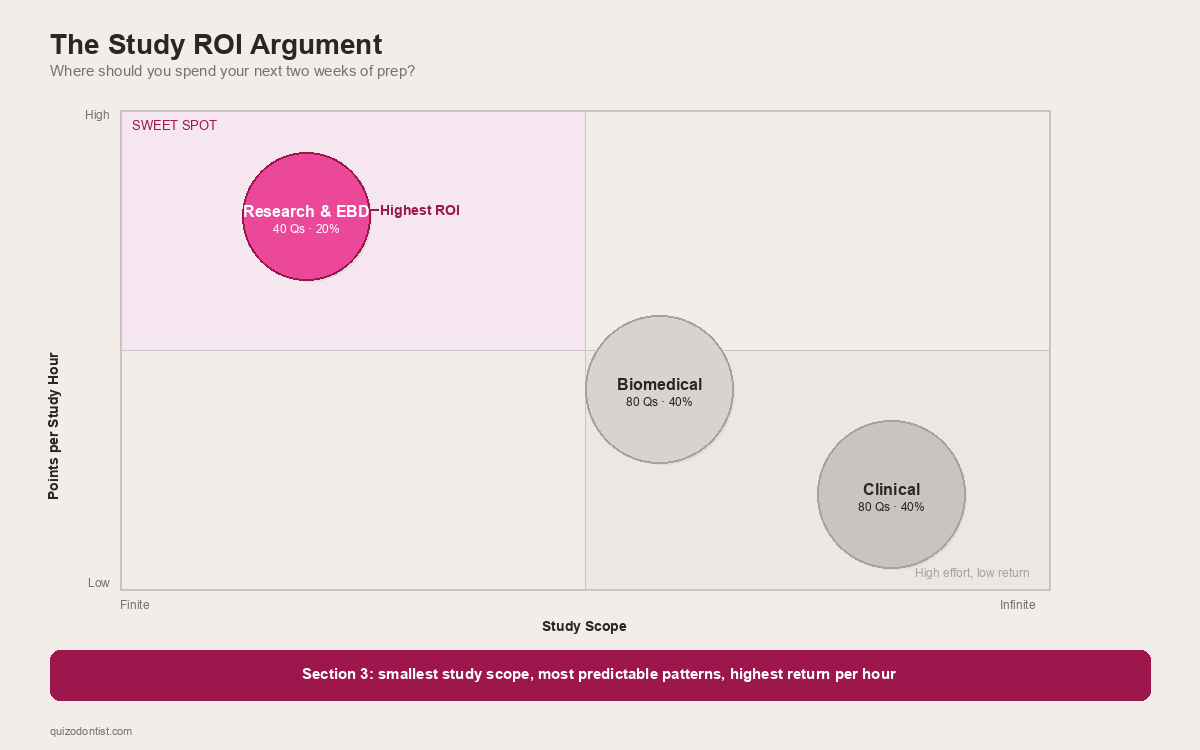
| Biomedical Sciences | 80 | Anatomy, biochemistry, microbiology, pathology — vast |
| Clinical Sciences | 80 | Every dental specialty, infinite depth |
| Research & EBD | 40 | A finite set of repeating patterns |
Clinical sciences could ask you about any condition, any procedure, any drug interaction across every dental specialty. Two weeks of studying clinical sciences might cover one specialty well. Biomedical sciences is slightly more bounded but still enormous — the entirety of head and neck anatomy, all of biochemistry, all of microbiology and pathology.
Biostatistics? The content area is genuinely finite. The same types of questions show up in different clinical contexts, but the underlying patterns repeat every single time. Sensitivity will always come from a 2x2 table. A forest plot will always ask about the pooled effect size or heterogeneity.
Two weeks of focused biostatistics prep can realistically cover the entire section. Two weeks of clinical prep covers maybe endodontics. (Even then, you'd still second-guess yourself on MTA vs biodentine.)
Most candidates under-prepare for this section. Which means the curve — if there is one — favors the few who actually show up prepared.
What's Actually on Section 3
This isn't us telling you what to study. This is the ADA telling you what to study.
The 2026 ADAT Candidate Guide describes Section 3 as focusing on evidence-based dentistry concepts, including how to critically review research findings and apply them in clinical decision-making. The guide breaks it down into distinct content areas.
What's on it, and what the questions actually ask you to do:
Study Design & Methodology
You need to recognize study designs, not design studies. The exam describes a research scenario and asks: what type of study is this? or what is the main limitation of this design?
The study types you need cold: RCTs, cohort studies (prospective and retrospective), case-control studies, cross-sectional studies, and systematic reviews/meta-analyses. You also need to spot methodological problems — small sample sizes, selection bias, lack of blinding, inappropriate controls.
The ADA isn't testing whether you can run a study. They're testing whether you can read one and know when to trust it.
Diagnostic Test Statistics
If you study one thing in Section 3, study this.
The 2x2 contingency table is the backbone. From it, everything else flows: sensitivity, specificity, PPV, NPV, and likelihood ratios. You need to know what each one measures, how to pull it from a table, and — critically — how prevalence affects predictive values. A screening test with 99% sensitivity can still have a terrible PPV in a low-prevalence population. This concept trips up more candidates than almost anything else in the section.
Here's a real question from our ADAT question bank. Can you get it right?
If that question made you pause, you're in good company. That's exactly the kind of reasoning Section 3 demands — and exactly the kind of pattern that becomes automatic with practice.
Data Analysis & Interpretation
You won't calculate a single p-value on the ADAT. But you will be handed a research summary and asked: is this result statistically significant? Is it clinically meaningful? Did the researchers use the right test?
That last question is where most candidates fall apart. The exam will describe a study — say, comparing periodontal outcomes between two treatment groups — and ask which statistical test is appropriate. If you don't know the difference between a t-test (two groups, continuous data) and a chi-square test (categorical data), you're guessing. If the data isn't normally distributed, the answer might be a nonparametric alternative like Mann-Whitney or Kruskal-Wallis, and you need to know when that switch happens.
The other recurring trap: confusing statistical significance with clinical significance. A study might report p = 0.03 for a new fluoride varnish that reduces caries by 0.2%. Statistically significant? Sure. Would you change your practice over it? Probably not. The ADAT will test whether you can tell the difference, usually by pairing a p-value with a confidence interval and asking you to interpret both together.
You also need to be solid on Type I errors (finding an effect that isn't there) and Type II errors (missing an effect that is). The classic question format: "The study found no significant difference between groups. The sample size was 12. What is the most likely explanation?" If you don't immediately think "underpowered study, high risk of Type II error," you'll miss it.
Here's another one from the question bank — this one catches people who think a low p-value automatically means the treatment works:
Reading the Charts
The ADAT will put a chart on screen and ask you to interpret it. No context clues, no process of elimination. You either recognize the visual pattern or you don't.
Forest plots are the most common. You'll see a series of horizontal lines (one per study), each with a square showing the point estimate and whiskers showing the confidence interval. At the bottom, a diamond represents the pooled result. The question will typically ask one of three things: Is the overall effect significant? (Does the diamond cross the line of no effect?) How consistent are the studies? (What does the I² tell you about heterogeneity?) Or Which individual study had the largest effect? If you've never seen a forest plot before, all of this looks like abstract art. If you've practiced with 10 of them, it's a 30-second answer.
Here's one from our question bank — a meta-analysis of fluoride varnish effectiveness for caries prevention:
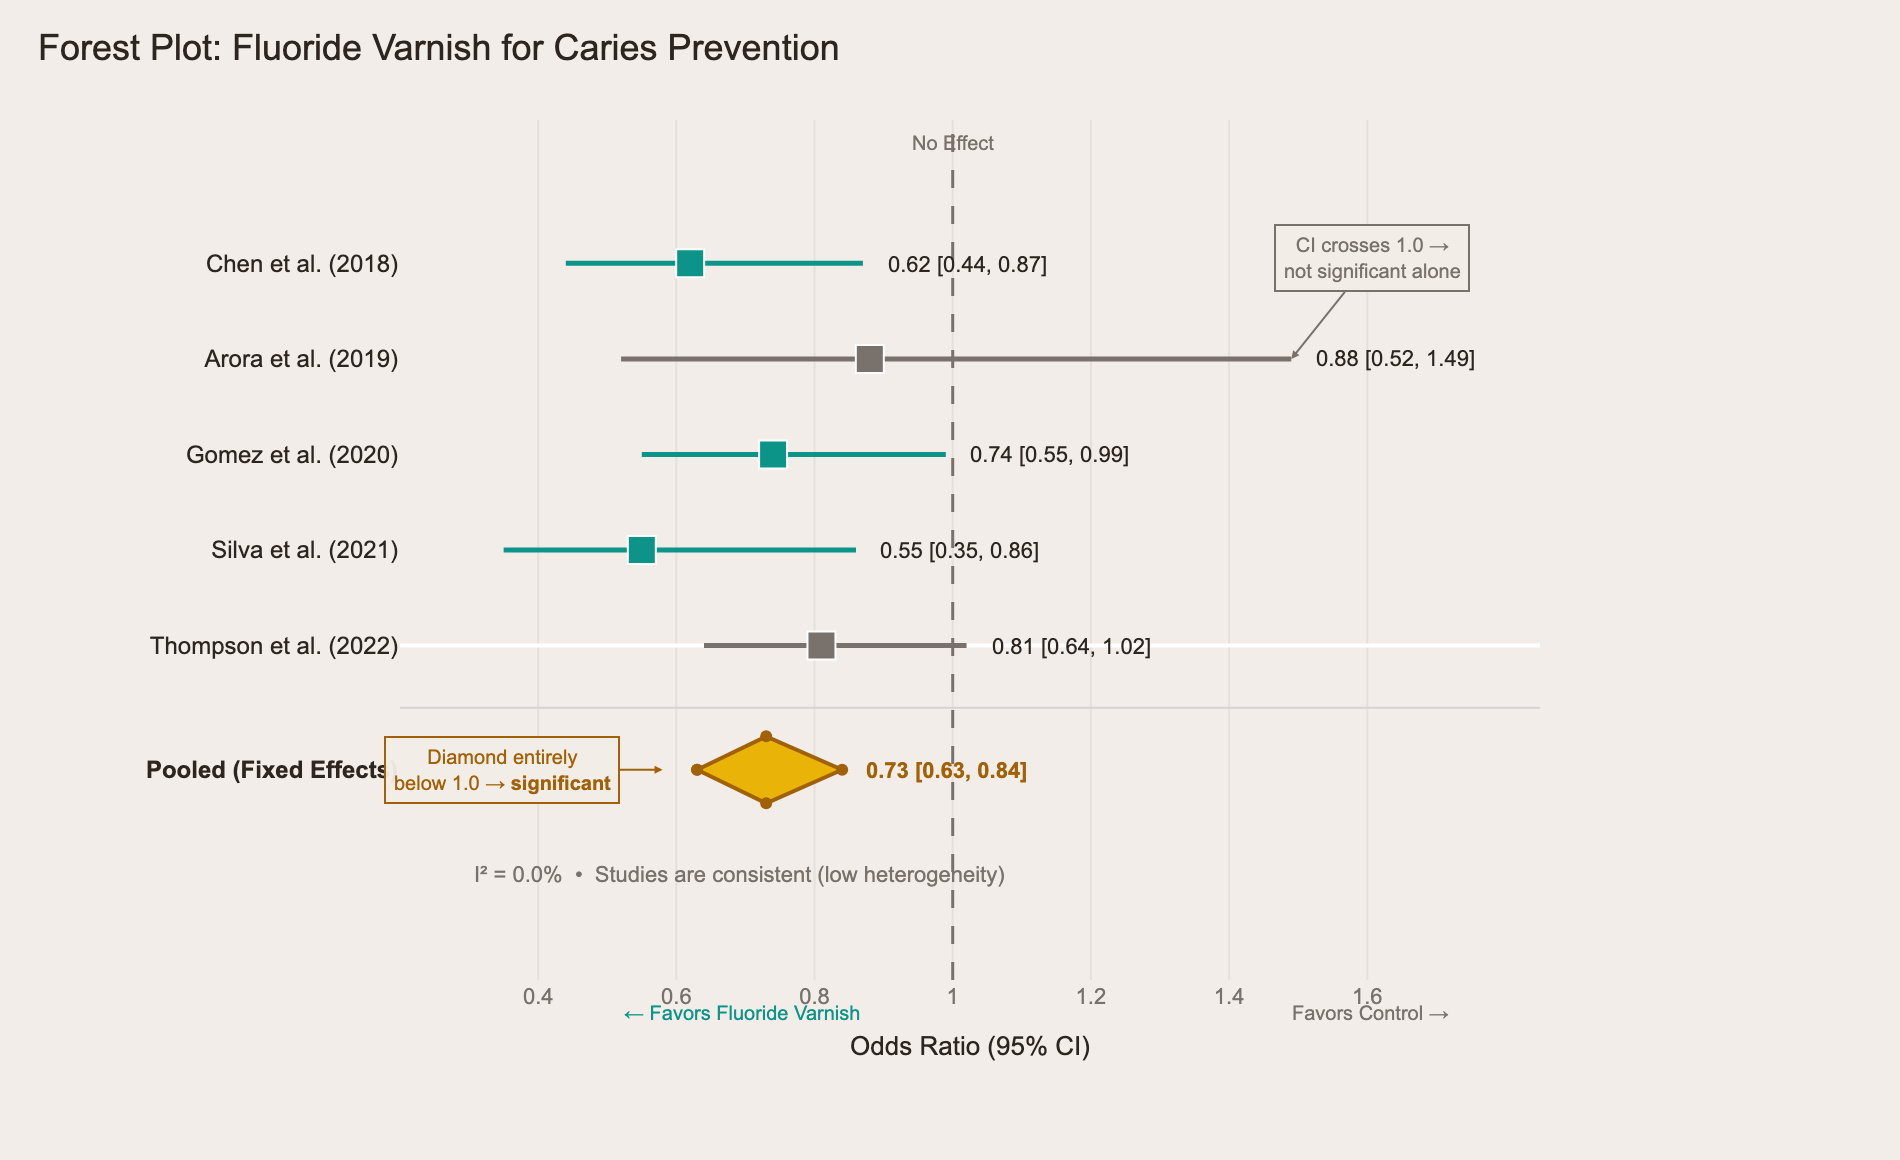
The teal studies have confidence intervals entirely below 1.0 — statistically significant on their own. The gray ones (Arora, Thompson) cross the line of no effect, meaning they're not significant alone. But look at the yellow diamond at the bottom: it sits entirely below 1.0, meaning the combined evidence favors fluoride varnish. The I² of 0.0% tells you the studies agree with each other. Three things to spot, three questions the exam can ask, one chart.
ROC curves test your understanding of diagnostic test performance. The curve plots sensitivity against 1-specificity at different thresholds. A test that hugs the top-left corner is excellent. A diagonal line is a coin flip. The exam might show you two ROC curves for different tests and ask which one is the better diagnostic tool — the one with the larger area under the curve wins. They might also ask what happens to sensitivity and specificity as you move the threshold cutoff along the curve (one goes up, the other goes down).
Here's a comparison of two salivary biomarkers for oral cancer detection:
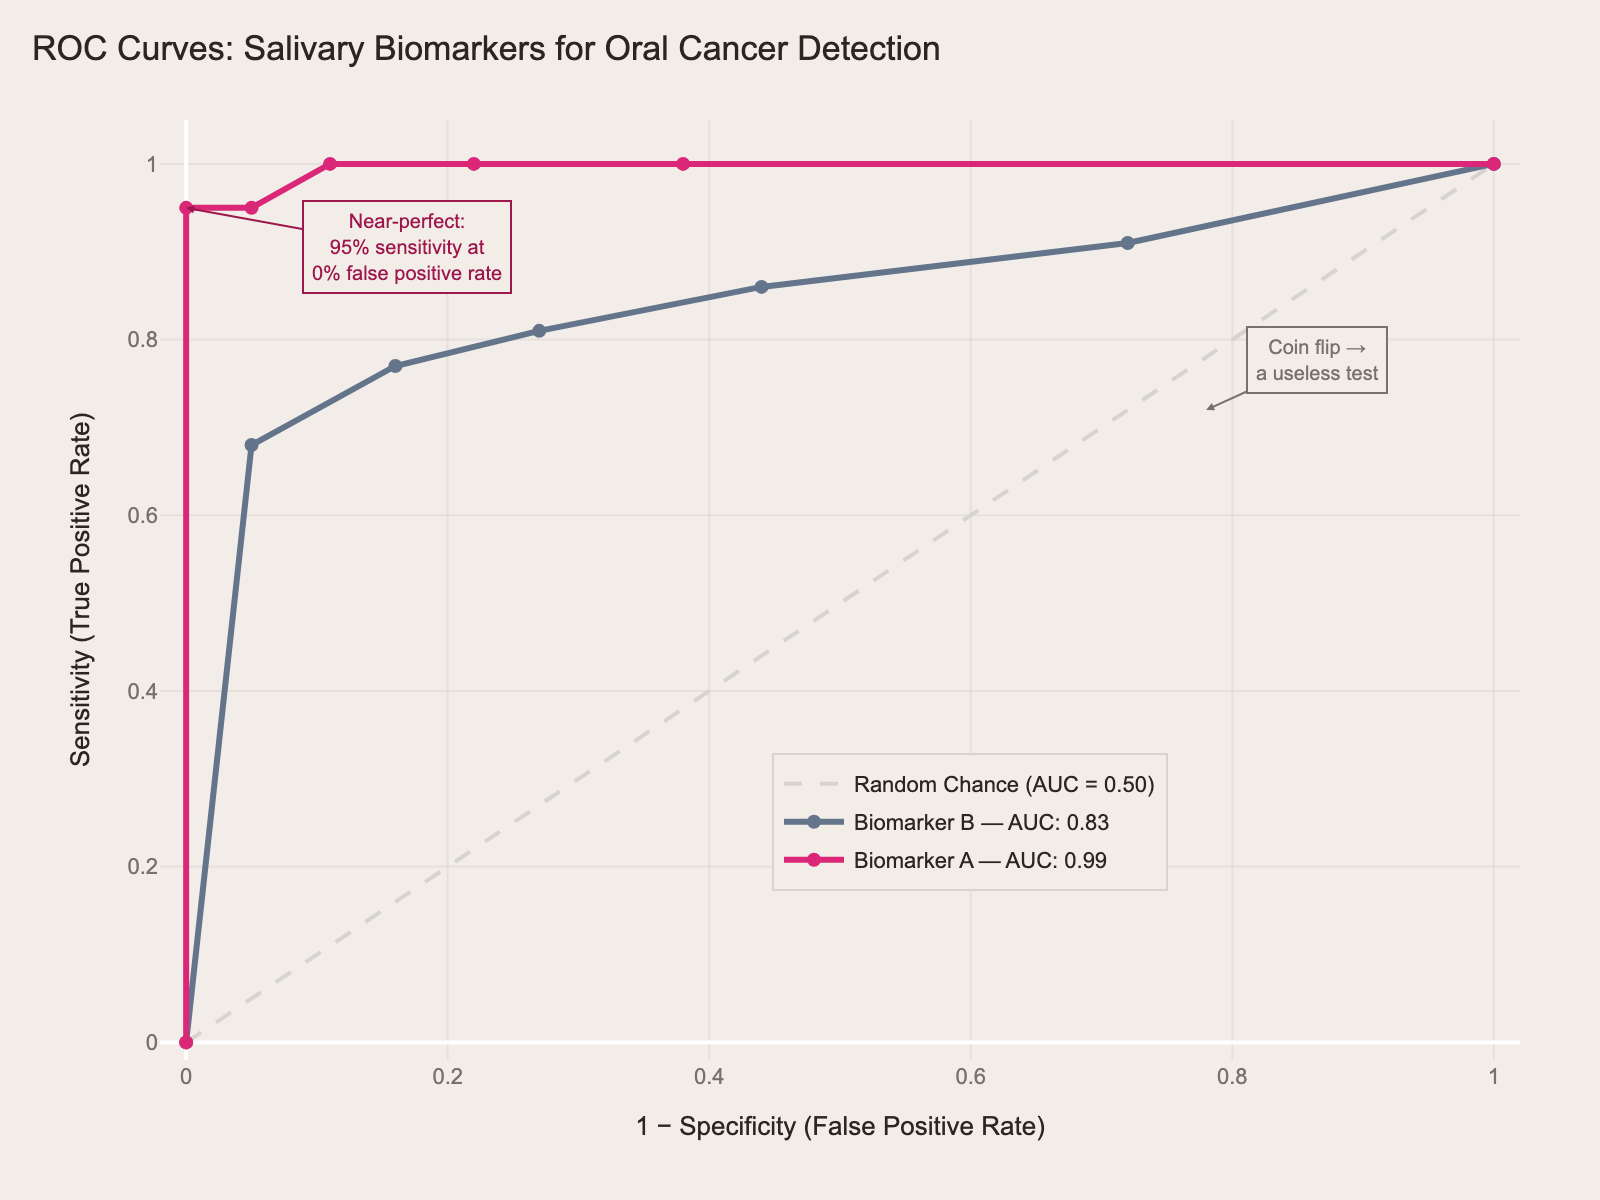
The magenta curve (Biomarker A, AUC = 0.99) hugs the top-left corner — near-perfect. It achieves 95% sensitivity with virtually no false positives. The gray curve (Biomarker B, AUC = 0.83) is decent but clearly inferior — it trades off more false positives for each gain in sensitivity. If the exam shows you two curves and asks "which test is the better diagnostic tool?" — the answer is always the one with more area under the curve.
Kaplan-Meier survival curves show up in questions about implant survival, treatment outcomes, or disease progression. The curve steps down each time an event occurs. The exam will show you two curves — say, implant survival with and without bone grafting — and ask whether the difference is significant, or what the 5-year survival rate is for each group. The small vertical tick marks on the curve represent censored patients (lost to follow-up), and knowing what censoring means is fair game.
The first time you looked at a periapical film, it was just gray blobs. Now you can spot a PAP in half a second. Forest plots work the same way. Repetition is the only prep strategy that works here.
Risk Measures & Evidence-Based Dentistry
This is where ADAT diverges most from the INBDE. The INBDE asks you to define relative risk. The ADAT asks you to use it.
A typical question: "A new periodontal treatment reduces the rate of tooth loss from 8% to 3%. What is the number needed to treat?" If you can't get from those two numbers to NNT = 20, you've lost an easy point. The exam might follow up: "Is this NNT clinically acceptable?" Now you're not just doing arithmetic — you're making a judgment call about whether treating 20 patients to prevent one tooth loss is worth the cost, time, and side effects. That's the ADAT asking you to think like a specialist, not a student.
Here's how the math works in practice, using data from a fluoride varnish RCT in our question bank:
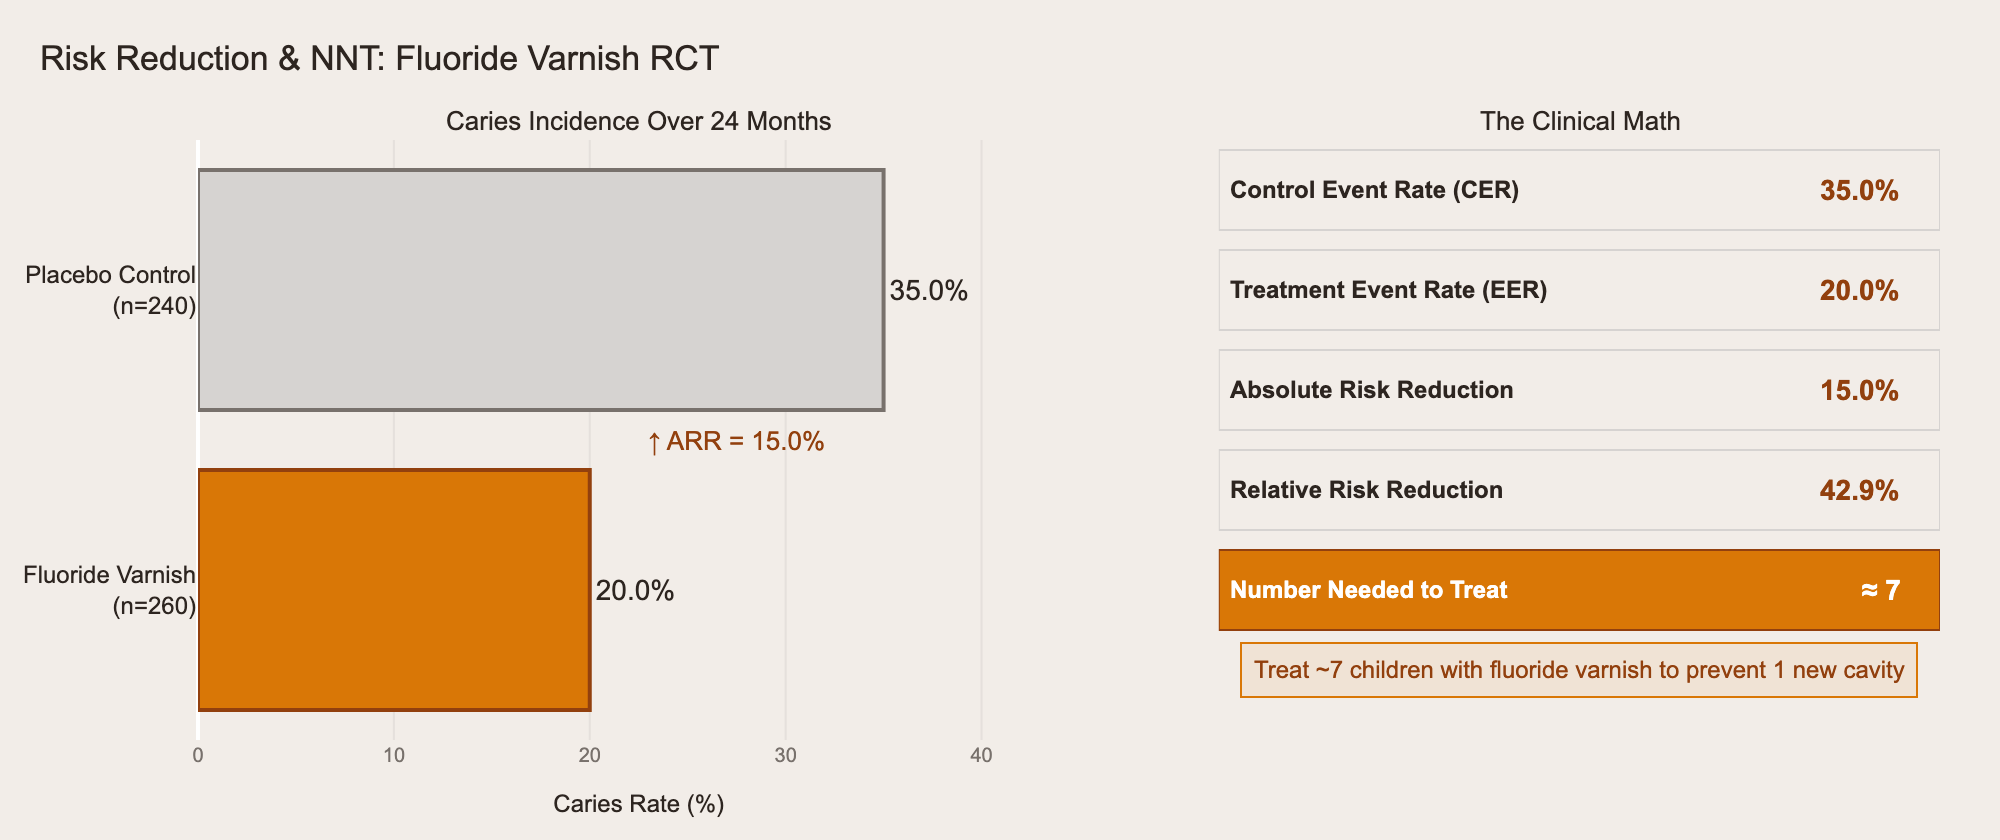
The gray bar is the control group: 35% developed caries. The orange bar is the treatment group: 20%. The absolute risk reduction is 15%, which gives you NNT ≈ 7 — treat 7 children with fluoride varnish to prevent one new cavity. The exam won't always give you the math this cleanly, but the pattern is always the same: CER minus EER equals ARR, and 1/ARR equals NNT.
Relative risk vs. odds ratio is another distinction the exam tests directly. You need to know that relative risk comes from cohort studies and RCTs (where you can calculate actual incidence), while odds ratios come from case-control studies (where you can't). The exam will describe a study design and ask which measure of association is appropriate — if you pick the wrong one, you've shown you don't understand the study design either.
The PICO framework shows up in questions about formulating clinical questions: given a patient scenario, can you identify the Population, Intervention, Comparison, and Outcome? These are usually straightforward if you've practiced them, but surprisingly easy to overthink under exam pressure.
Finally, bias recognition is tested through study scenarios. The exam describes a study and asks you to identify the flaw. Was the sample selected in a way that skews results? (Selection bias.) Did the researchers know which group was getting treatment? (Observer bias.) Did a screening study detect disease earlier without actually extending survival? (Lead-time bias.) You need to recognize these patterns in context, not just recite definitions.
The ADA is testing whether you can evaluate research like someone ready for advanced training — not just define terms, but apply them to real clinical decisions about real patients.
You Already Think This Way
You already know how to do this. You just haven't made the connection.
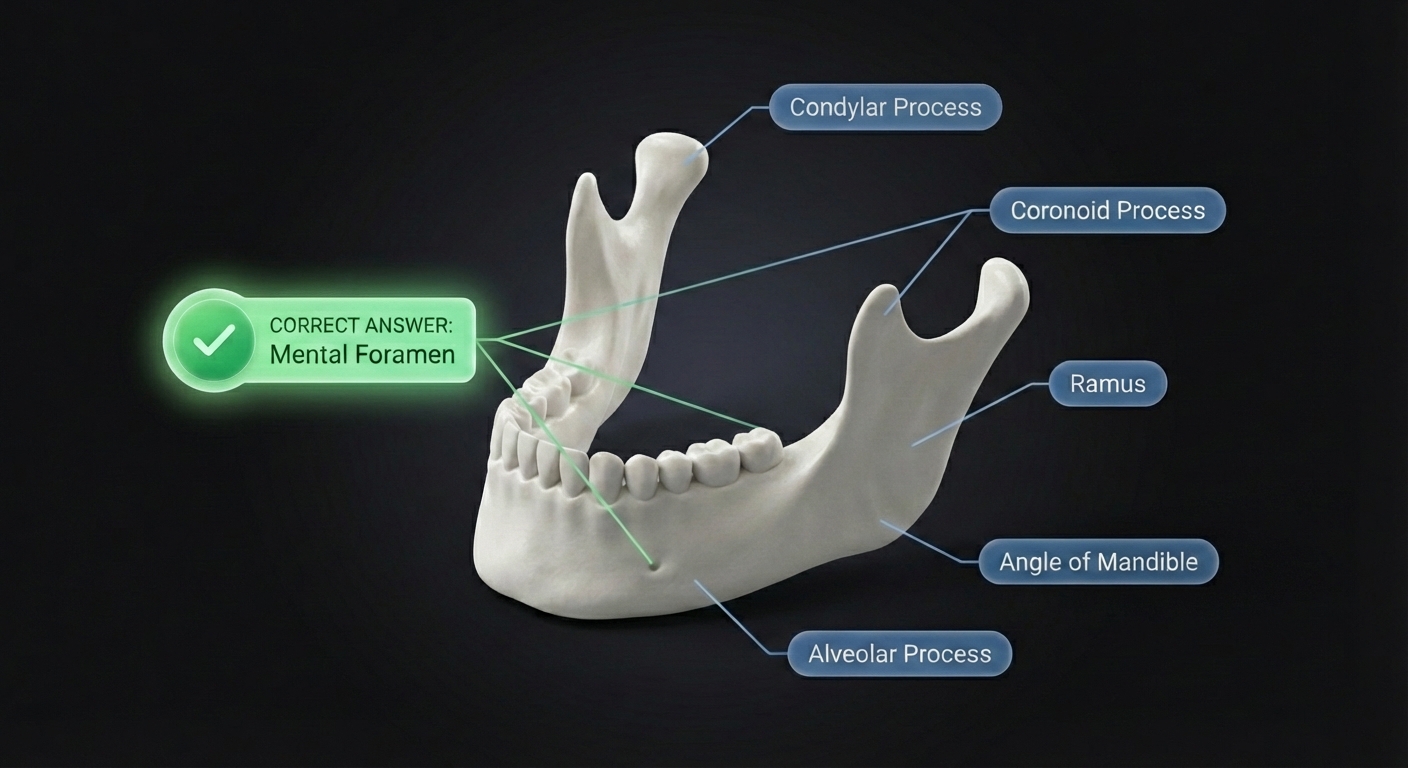
Every day in clinic, you pattern match. Swelling, location, duration, radiographic findings — you see a radiolucent lesion at the apex of a non-vital tooth and you don't think about it. Periapical pathology. Burned in from hundreds of cases.
A 2x2 table is the same kind of pattern. So is a forest plot. So is NNT. Different packaging, same cognitive skill.
The reason most candidates struggle isn't that biostatistics is hard. It's that they study clinical sciences for months — hundreds of pattern exposures — and give biostatistics a single weekend. Maybe 10 exposures, if they're generous. You wouldn't diagnose a Le Fort fracture after seeing one image in a textbook. You needed dozens. Same thing here.
Where to Start
Free foundational content: We've published a three-part biostatistics series for the INBDE that covers the same core concepts. The underlying principles are identical across both exams — start with The Foundation, then move to Advanced Chart Types and Concepts Without Charts.
INBDE Biostatistics: The Foundation
ADAT-specific practice:
Weighing ADAT against other exams?
AFK vs ADAT: Which Exam Do You Actually Need?
Don't Be That Candidate
You know the one. Studied clinical sciences backwards and forwards. Could name every complication of a Le Fort fracture. Could classify every Kennedy classification in their sleep. Walked into Prometric feeling confident.
Then Section 3 loaded. A 2x2 table. A forest plot. A question about NNT. A study design they couldn't identify. Forty questions of patterns they'd never practiced.
Don't be that candidate. Forty questions. Twenty percent of your score. The most predictable section on the exam. And the one almost nobody prepares for properly.
You're not a statistician. You don't need to be. You just need to recognize the patterns — and the only way to do that is to start.