You know your score. You know the trend. But "I'm averaging 68%" doesn't tell you what to study tonight. Is Pharmacology the problem, or Oral Pathology? Are you getting Easy questions wrong, or just never attempting Hard ones? Are you losing points because you don't know the answer, or because you're spending three minutes on questions you'll never get?
Three analytics tabs sit alongside the Score Trend on your dashboard, and each one answers a different version of those questions. This tutorial walks through every chart — what it is, how to read it, and what to do about what you see.
Subject Analytics
This tab answers one question: where should you spend your next study session?
Quiz Distribution treemap
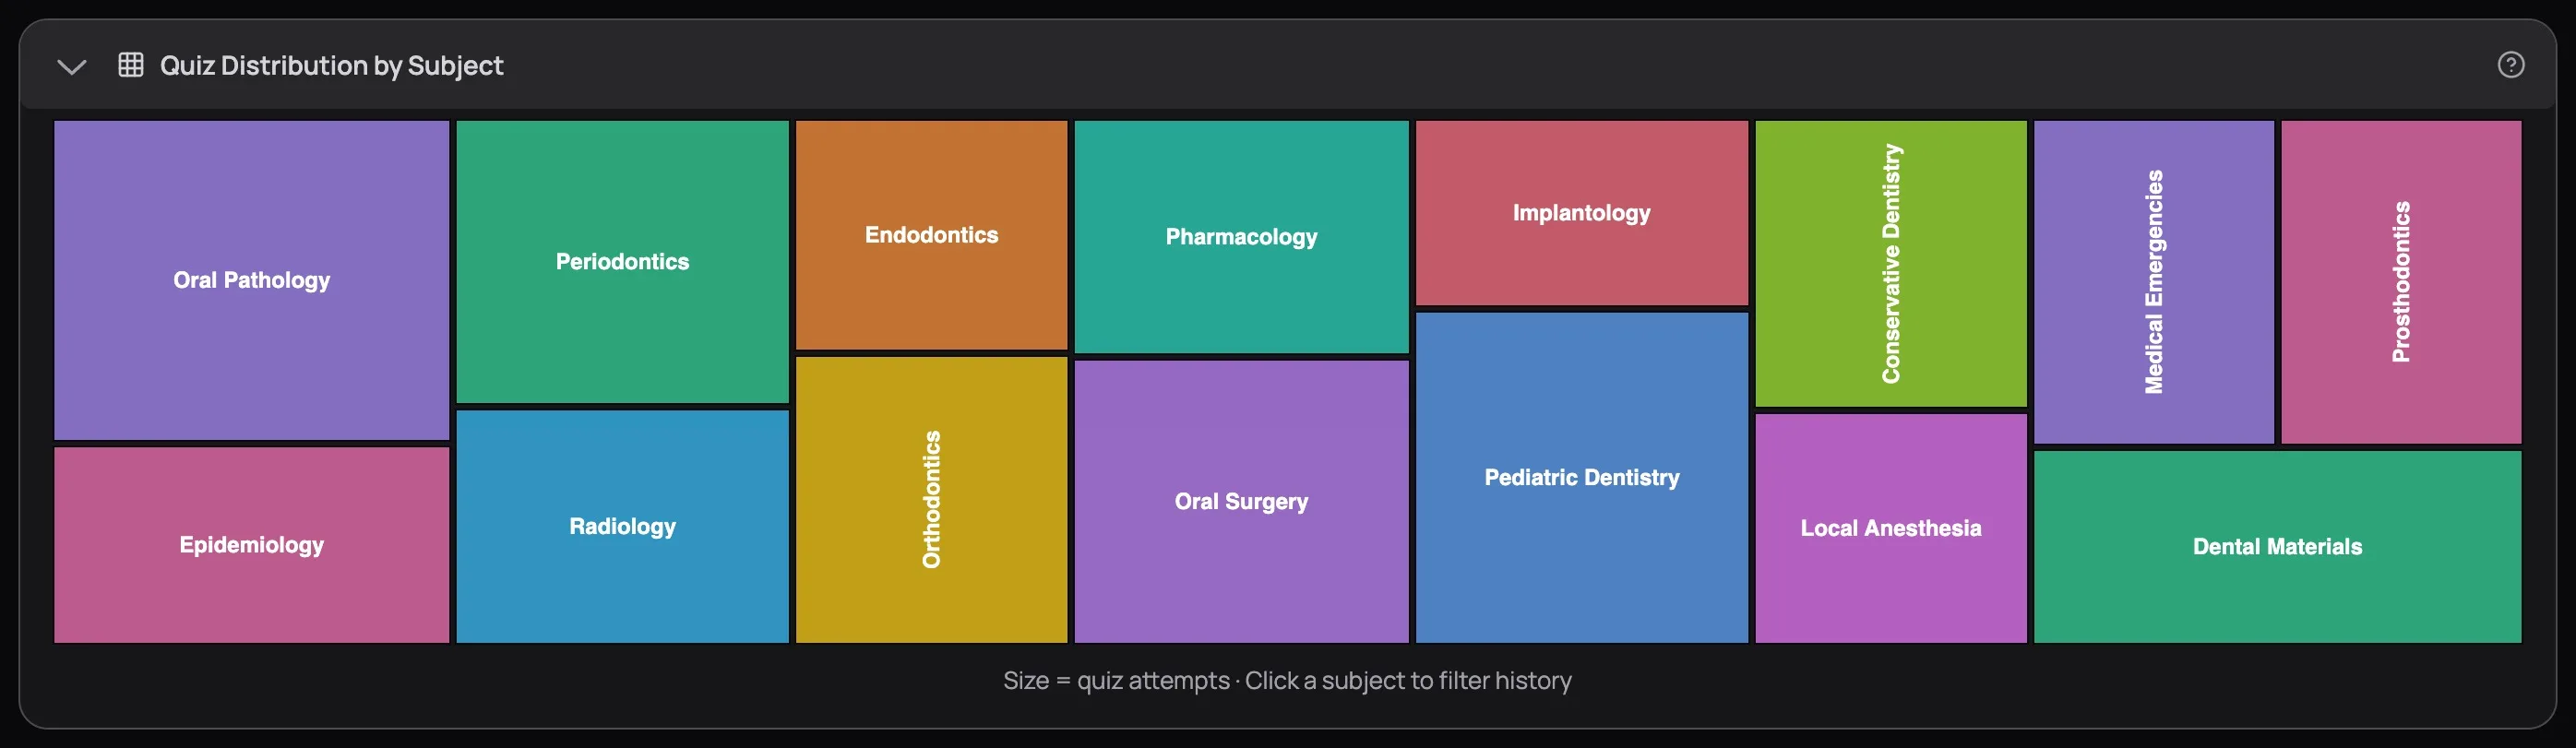
A treemap is a chart where data is shown as rectangles of different sizes — the bigger the rectangle, the more weight that item carries. Here, each rectangle is a dental subject, and its size tells you how many quiz attempts you've put into it.
Three patterns to look for:
- Big rectangle, low score — you've practised this subject a lot and it still isn't clicking. More reps of the same won't help. Switch tactics: use the AI Tutor to work through specific weak spots, or go back to the Learning Centre readings.
- Big rectangle, high score — you're solid here. Stop spending time on it. Every hour on a subject you already own is an hour stolen from one you don't.
- Tiny rectangle or sliver — a blind spot. In the screenshot, Prosthodontics and Medical Emergencies are barely visible. If the exam covers them (it does), you need more attempts there. Small rectangles hide nasty surprises on exam day.
Hover over any rectangle to see your average score, attempts, and correct/total breakdown.
Performance radar chart
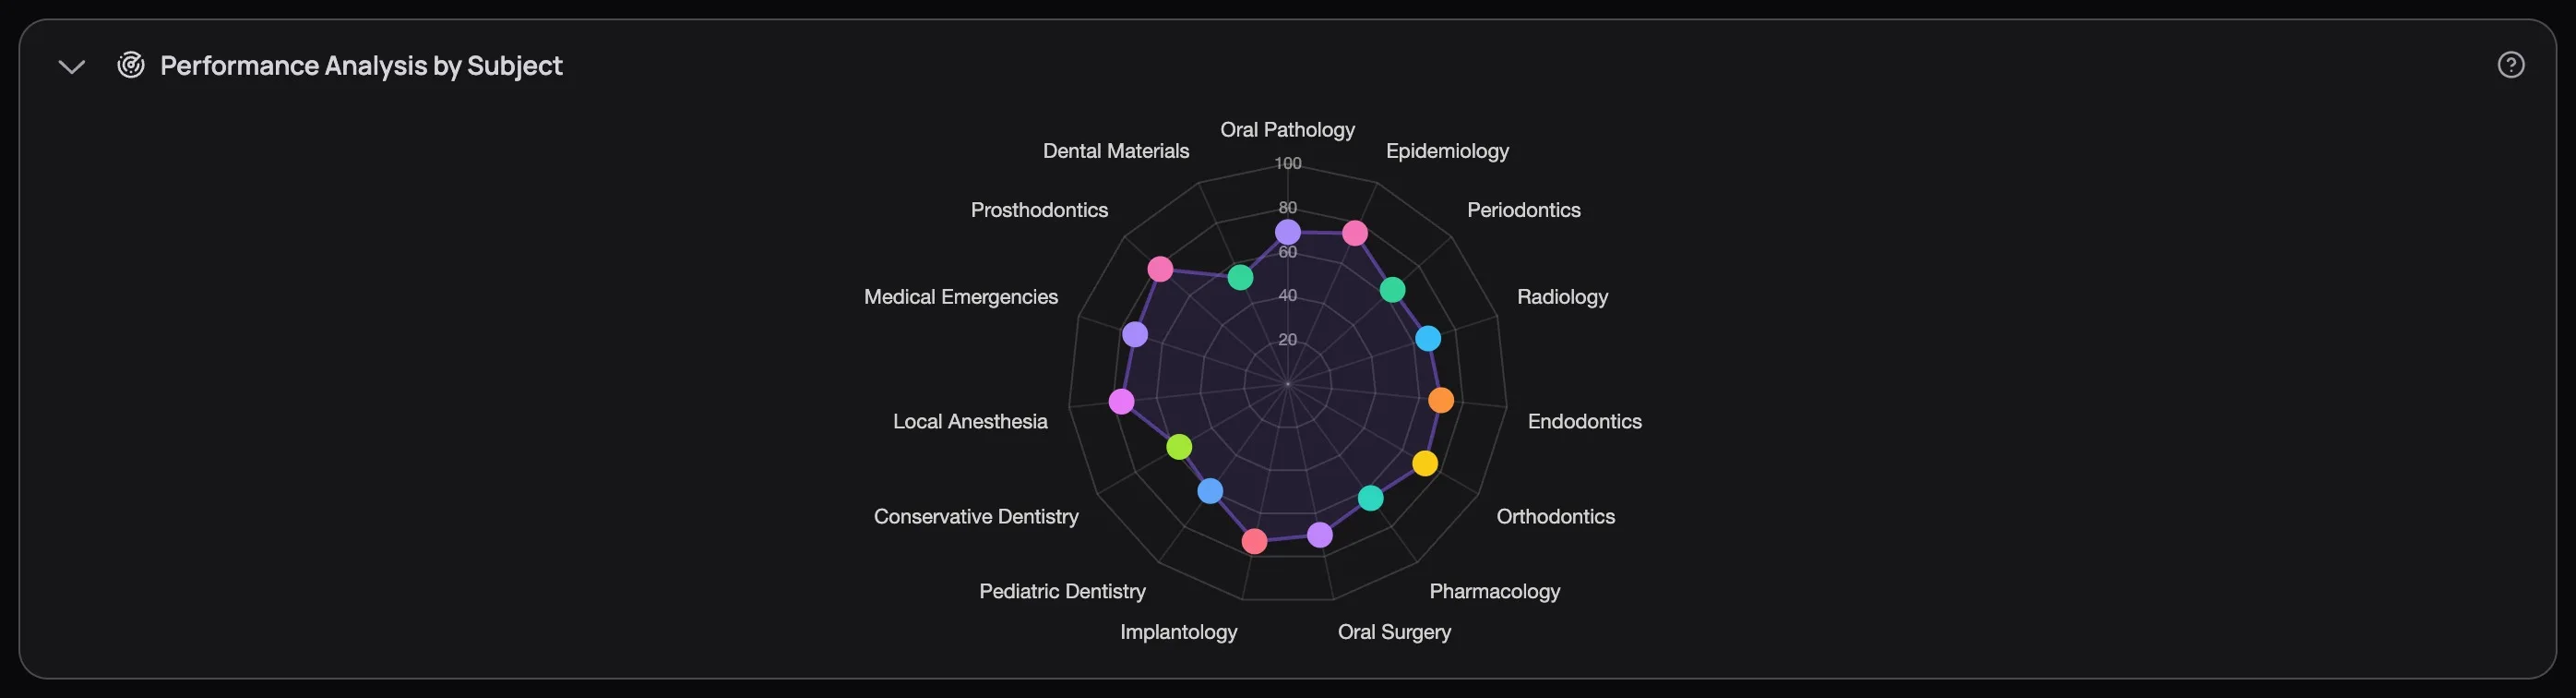
A radar chart — sometimes called a spider-web chart — plots multiple categories around a central point, like spokes on a wheel. Each spoke is a subject, and how far your score reaches along that spoke shows your accuracy. Connect all the points and you get a shape. A perfectly balanced candidate would see a circle.
You won't see a circle. Nobody does. And that's the point.
The dents are your priorities. Every inward pull is a subject dragging your overall average down. In the screenshot, Endodontics, Orthodontics, and Pharmacology dip furthest inward. The peaks — Oral Pathology, Dental Materials, Epidemiology — are strong and don't need your time right now.
Pick the two deepest dents. Go to Custom Mock Builder and build mocks targeting those subjects. Take 3–4 targeted quizzes over the next week, then come back and check if the dents are filling in.
If you've only practised 2 subjects so far, the radar falls back to a bar chart — you need at least 3 data points for the spider-web to work. Keep taking quizzes across different subjects and it'll appear.
Click any rectangle in the treemap or any point on the radar to filter your History table to that subject — quick way to find the specific quizzes dragging a subject's average down.
Difficulty Analytics
This tab answers: are you studying at the right level, and how consistent are you?
Average Scores bar chart
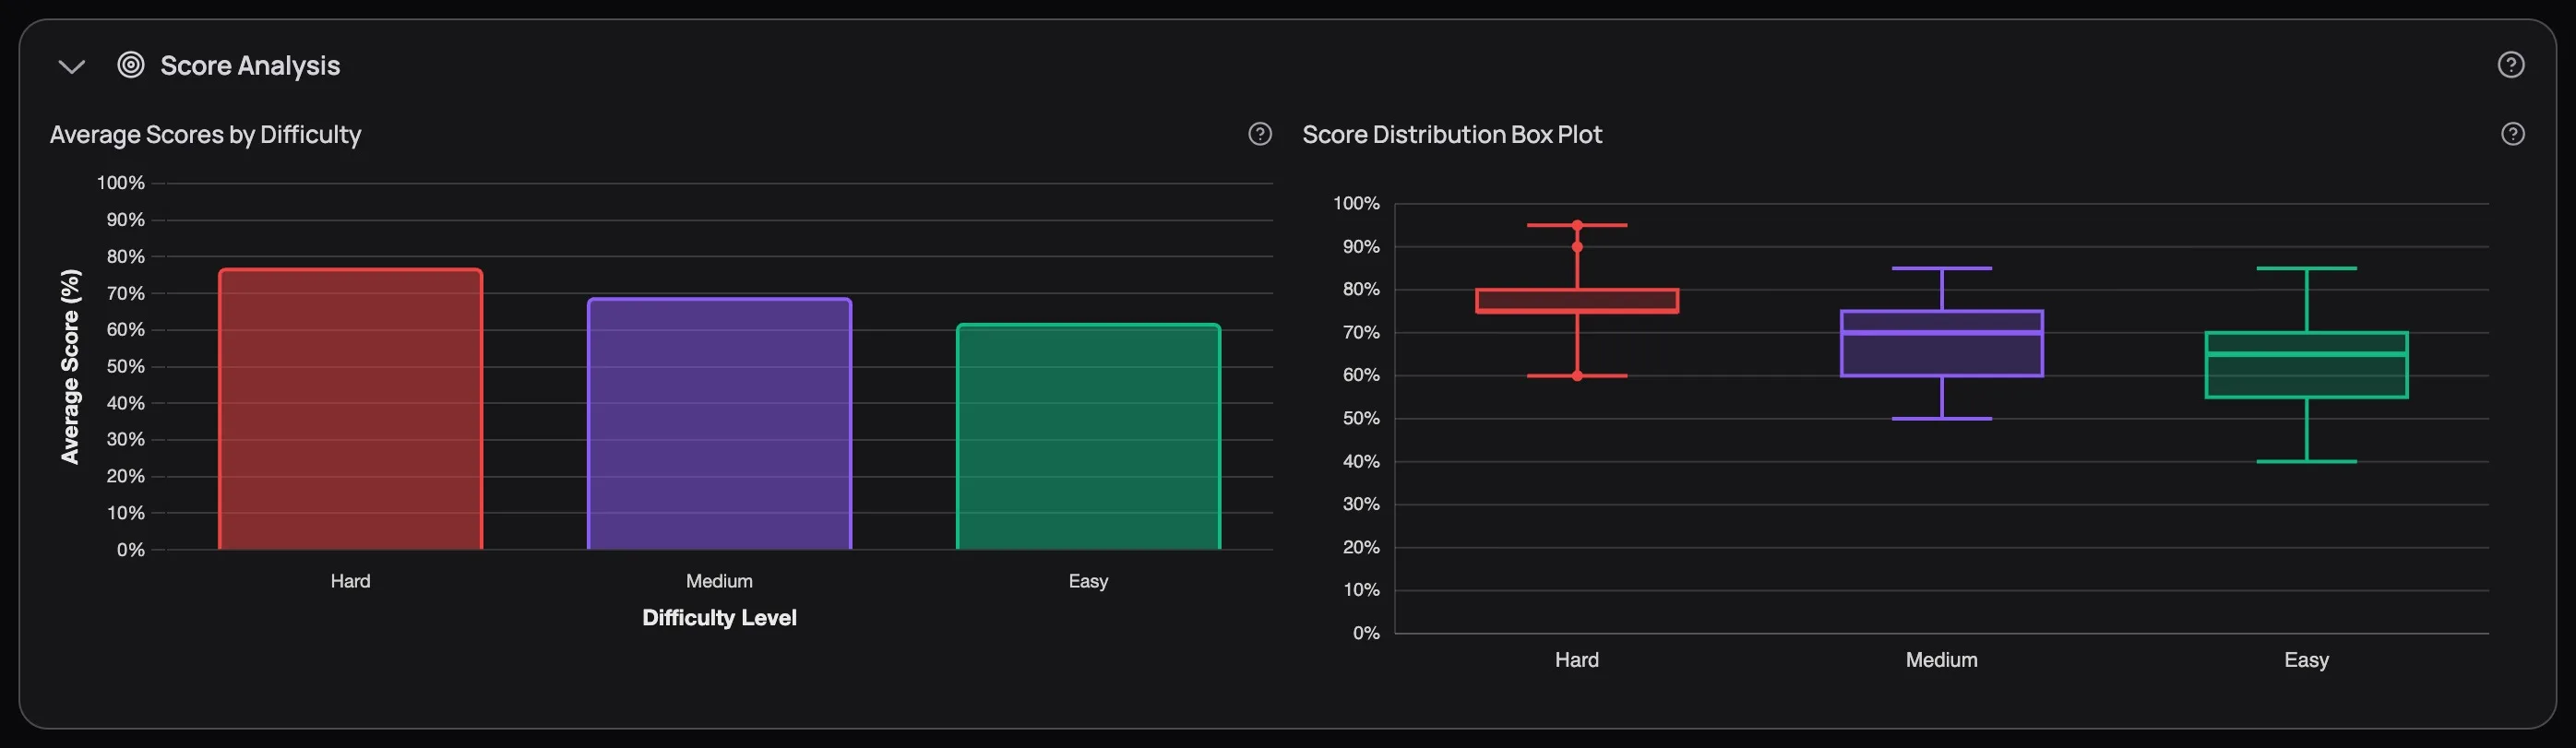
Three colour-coded bars — Hard (red), Medium (purple), Easy (green) — showing your average score at each difficulty level. The bar chart itself is straightforward, but the insight is in the pattern, not the individual numbers.
Look at the screenshot: Hard sits around 75%, Medium around 65%, Easy around 70%. Scoring higher on Hard than Medium is counterintuitive. When you see this, it usually means one of two things:
- Careless mistakes on medium questions. You assume they're straightforward, read too fast, and miss key words like "except" or "not." Fix: slow down on medium quizzes and read every option before selecting.
- You bring more focus to hard questions. You concentrate fully on hard quizzes but coast on medium ones. Same fix — treat every question like it counts, because on exam day, they all do.
The opposite pattern — Easy at 90%, Hard at 45% — tells a different story. You know the definitions but can't apply them to clinical scenarios. That calls for more case-based practice at higher difficulties.
Score Distribution box plots
If you haven't seen a box plot before, here's the short version: it's a chart that shows not just your average, but how spread out your scores are. A bar chart tells you "your Easy average is 70%." A box plot tells you "your Easy scores range from 55% to 85%, with most falling between 62% and 78%." That spread matters — it's the difference between consistent performance and wild swings.
Here's how to read one:
- The box itself — covers the middle half of your scores. If the box runs from 62% to 78%, half your quiz scores at that difficulty fell in that range.
- The line inside the box — your median score (the midpoint, not the average)
- The lines extending from the box (called whiskers) — show the full range of your typical scores
- Any dots floating beyond the whiskers — outliers, unusually high or low attempts
The key thing to look for is how wide the box is. A narrow box means you're consistent — you perform roughly the same every time at that difficulty. A wide box means you're volatile — nailing some quizzes and bombing others.
In the screenshot, Hard is a narrow box sitting high (consistent and strong). Easy has the widest box, stretching down toward 55%. That volatility is a signal: certain subjects within Easy difficulty are dragging you down while others are fine. Filter your quiz history to Easy quizzes and sort by score — the lowest-scoring subjects are what need work, not "Easy questions" as a whole.
Attempt Distribution donut
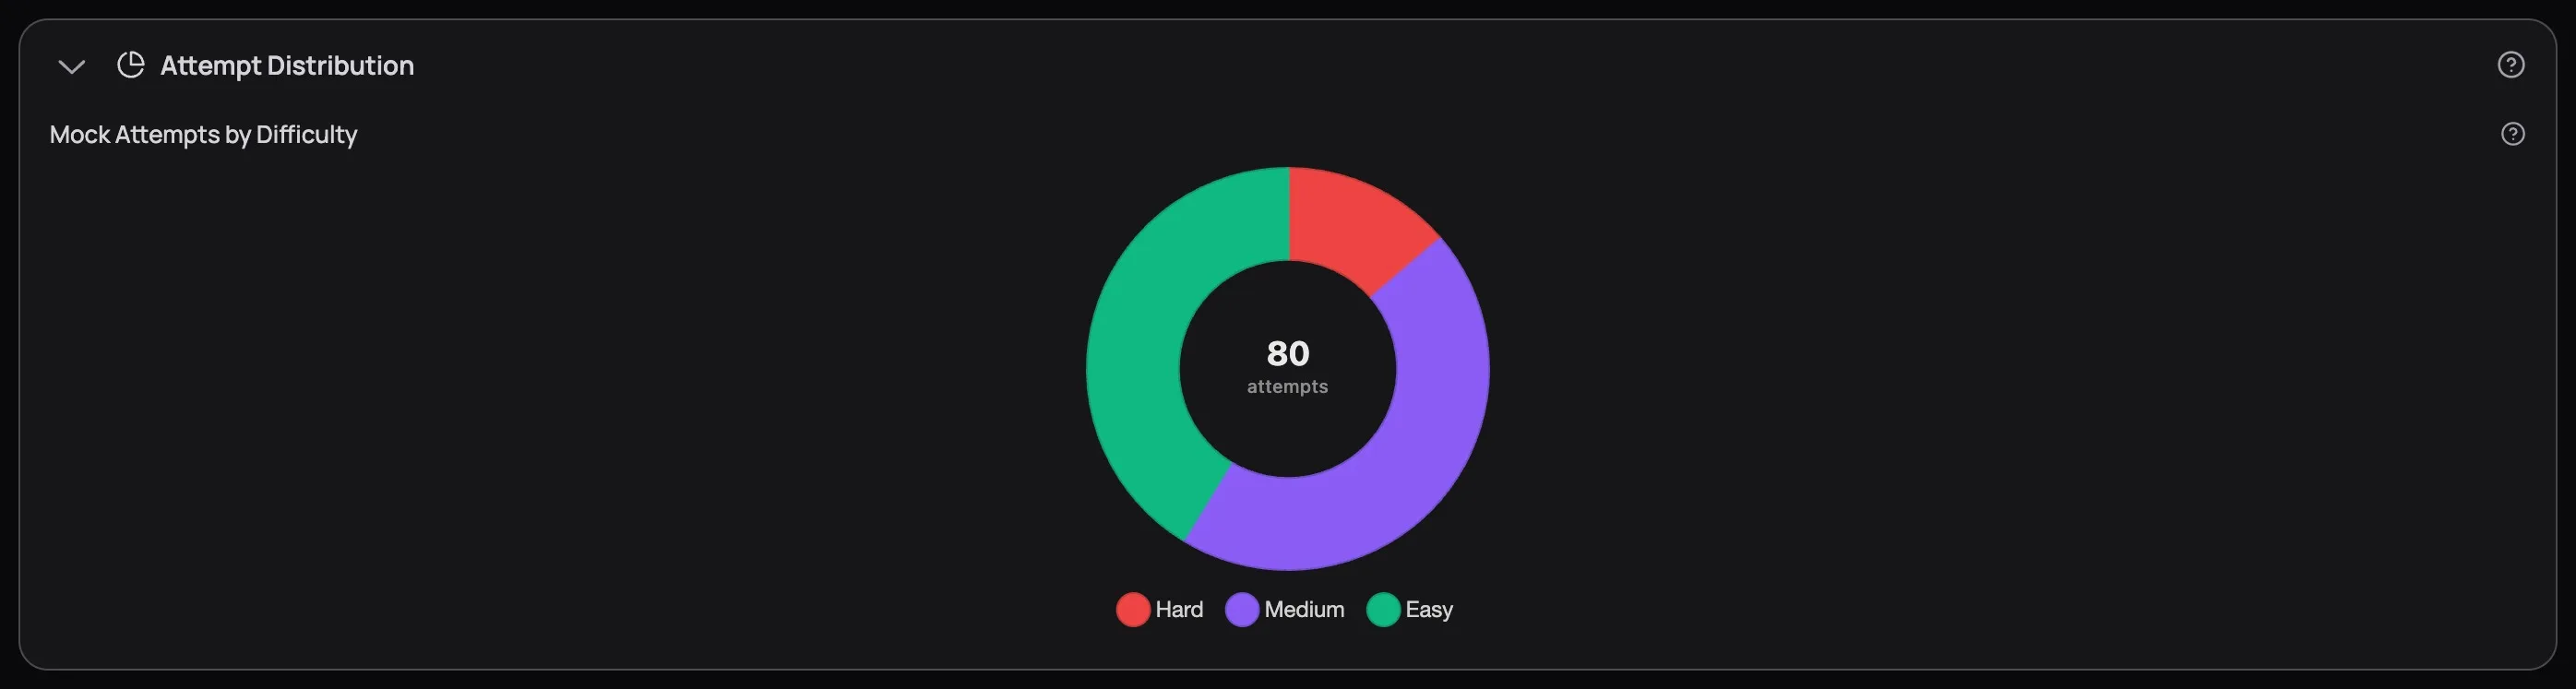
The donut shows how many quizzes you've taken at each difficulty. The number in the centre is your total attempts.
This chart is a reality check. If 80% of your attempts are Easy, you're building false confidence — the exam won't be Easy. If you're grinding Hard while your Easy scores are below 70%, you're skipping steps.
Get Easy above 85% before shifting to Medium. Get Medium above 75% before mixing in Hard. This isn't about ego — it's about building the foundational knowledge that hard questions assume you already have.
Time Analytics
This tab answers: is your speed costing you accuracy — or is accuracy costing you speed?
Subject time bars
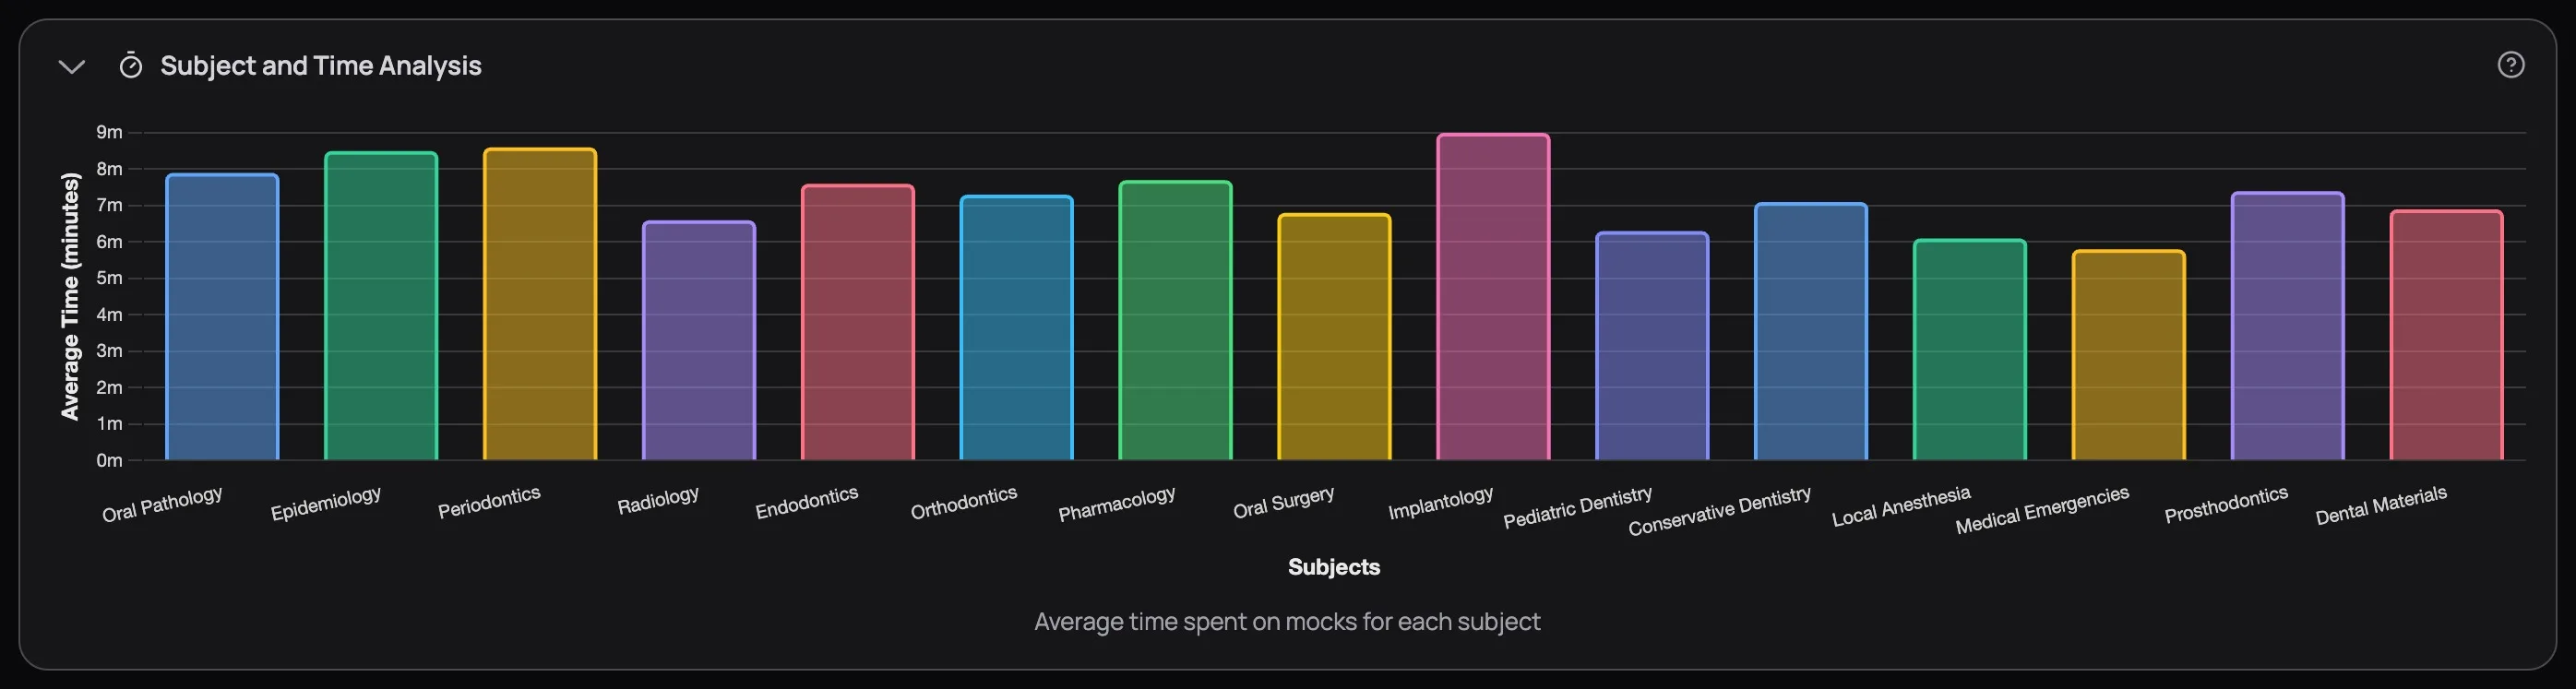
Each bar shows how many minutes you spend per 10 questions in a given subject. The insight comes from comparing these bars against your radar chart scores:
- Long time + low score — the material needs more study. You're re-reading questions, second-guessing, relying on elimination. Go back to the Learning Centre for this subject.
- Long time + high score — you know the material but don't trust yourself yet. Try timed quizzes to build confidence in your instincts.
- Short time + low score — you're rushing. Slow down, read every option, check for trick words.
- Short time + high score — this subject is locked in. Move on.
If one bar towers over the rest, that subject is eating disproportionate time — time that could go to subjects where you'd actually gain points.
Speed vs Accuracy scatter plot
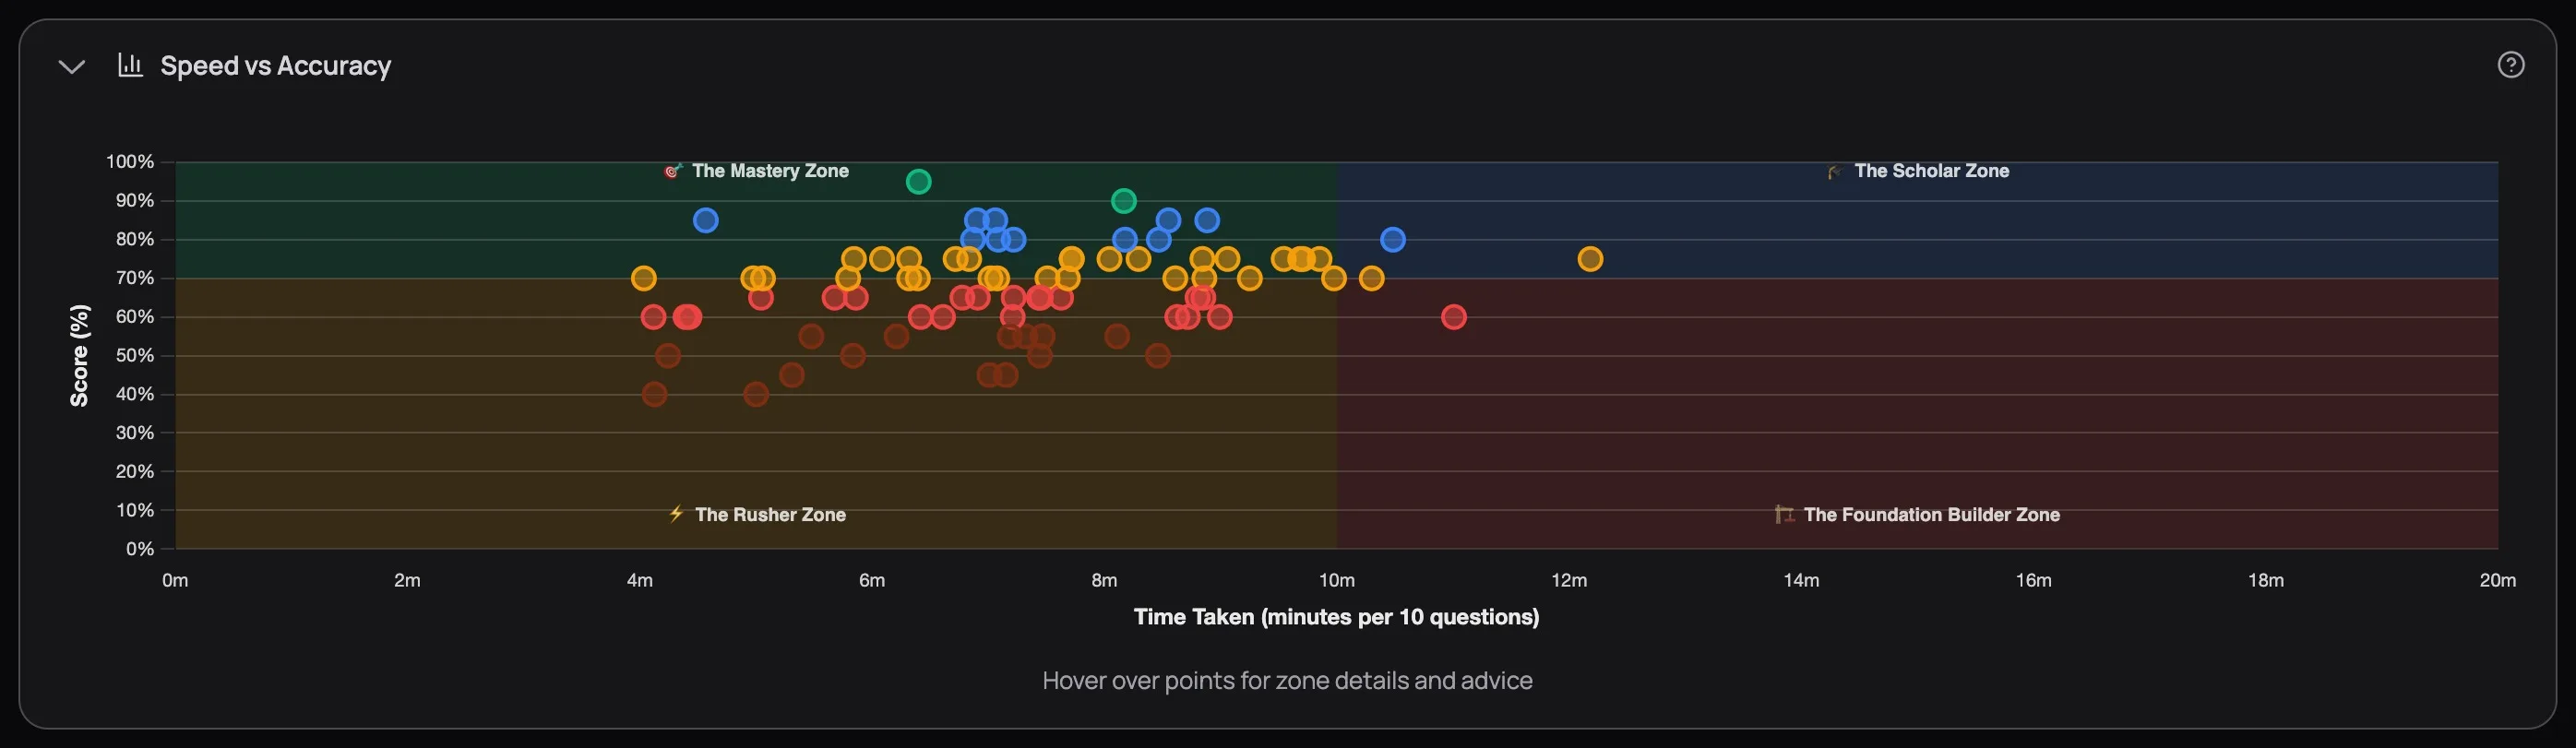
A scatter plot places each of your quiz attempts as a dot on a grid — time along the bottom, score up the side. Instead of averaging everything into one number, it lets you see every attempt at once and spot patterns your averages would hide.
The chart divides into four colour-coded zones, and each one tells you something specific:
| Zone | Position | What it means | What to do |
|---|---|---|---|
| Mastery (green) | Fast + high score | You know the material cold. | Move on to weaker subjects. |
| Scholar (blue) | Slow + high score | You're getting answers right but deliberating too long. | Practice under timed conditions. Your knowledge is there — trust it. |
| Rusher (orange) | Fast + low score | You're racing through and missing details. | Slow down. Read every option. Watch for "except" and "not." |
| Foundation Builder (red) | Slow + low score | The material needs more work. Speed isn't the issue. | Stop quizzing this subject. Go back to the Learning Centre and rebuild from the readings. |
Hover over any dot to see the quiz title, score, time, subject, difficulty, and personalised advice based on its zone.
Find where most of your dots cluster — that's your default study mode. If they're scattered across multiple zones, the pattern is subject-specific: check which subjects land in which zones. An Oral Pathology dot in Mastery and a Pharmacology dot in Foundation Builder need completely different responses.
The Mastery Zone isn't about being fast. It's about knowing the material well enough that you don't second-guess. Speed is a byproduct of understanding, not a goal. Candidates who try to speed up without building knowledge just migrate from Scholar to Rusher — and their scores drop.
Next Up
After reading this tutorial, you should be able to name three things: the subjects your radar chart dips lowest on, whether your box plots are narrow or wide, and which quadrant most of your scatter dots fall in. Those three answers are your study plan for the next two weeks.
To act on them, the Custom Mock Builder lets you build exams weighted toward exactly the subjects and difficulty levels you just identified.